
What a weekly GLP-1 does, measured
Calculations, comparisons and study analyses built on the FDA labels and published research, and a tracker that runs them on your own doses. Every number links to the table or paper it came from.
Your week at a glance: next shot, next site, today's level and your weight, from your own log on this device.
Instruments
Drag or hover · arrow keys move one day
Method and sources
One-compartment model with first-order absorption, summed over every weekly dose. The chart shows a share of the settled weekly peak, not a blood concentration.
| Drug | t½ | tₘₐₓ | Source |
|---|---|---|---|
| Tirzepatide | ≈ 5 days | 24 h (range 8–72 h) | Zepbound label, 12.3 |
| Semaglutide | ≈ 1 week | 1–3 days (model uses 2) | Wegovy label |
Real levels vary with body weight, dose changes and timing. An estimate of the shape of a week, not a lab result and not dosing advice.
● maintenance dose · ○ starting dose or a step on the way up · hover or tap a week · the level chart above follows this plan
The thresholds you have cleared and how many cleared them too
Your numbers on one page for you and your prescriber
Tap the ones you have had. Bars show how many people on reported each in the trials.
Read the evidence
Half of adults stopped within a year, and many came back
Why the day before your shot feels different
- ZEPBOUND (tirzepatide) prescribing informationFDA 2026 · NDA 217806/S-042 · 2.1–2.3, 12.3, Table 1
- WEGOVY (semaglutide) prescribing informationFDA 2026 · NDA 215256/S-033
- Rodriguez et al., JAMA Network Open 2025;8(1):e2457349Cohort study · n = 125,474
- Lilly Medical: Zepbound after the last doseManufacturer answer
The same instruments, on your own doses
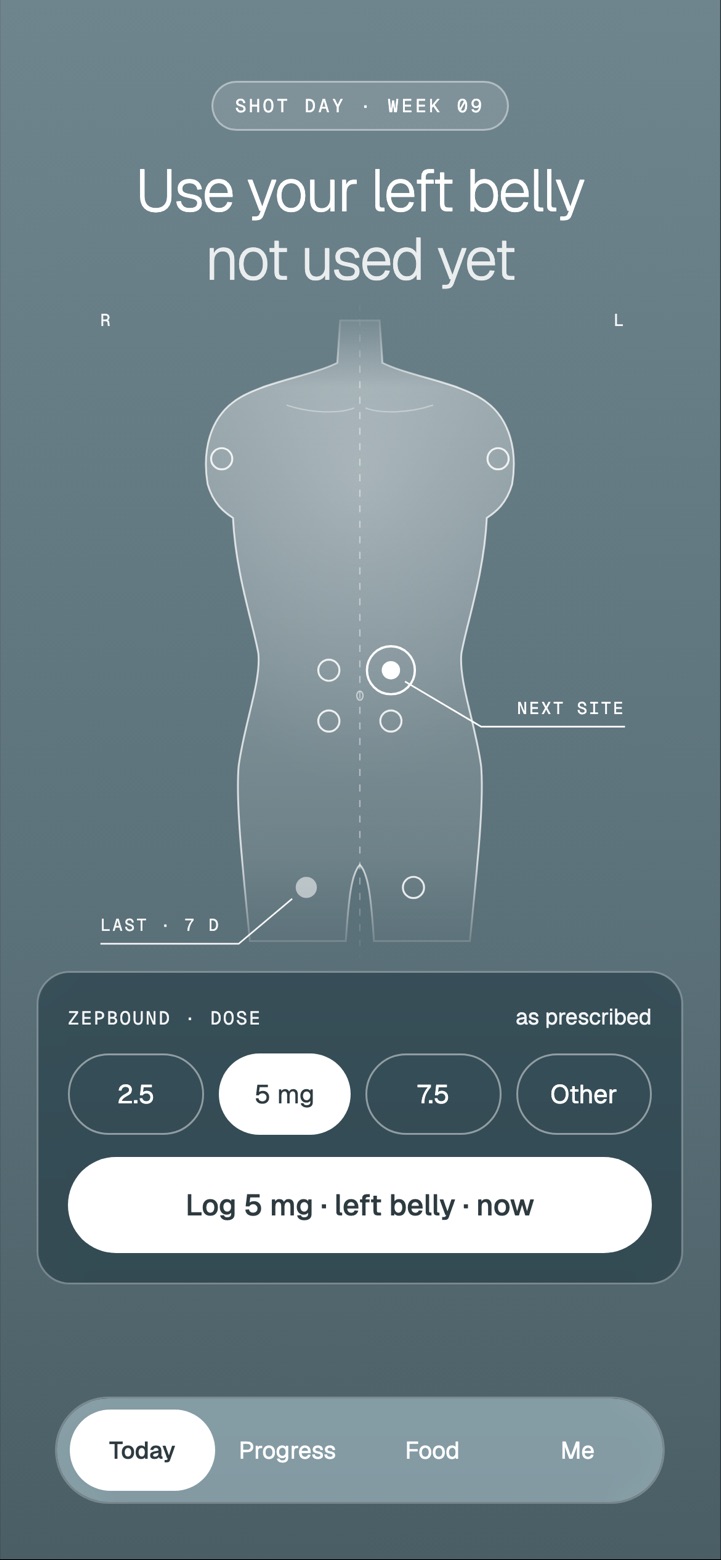
Log a shot in one tap. See your next site and your week.
The dose log, site rotation and full export are free forever. Pro adds your own level curve, weight trend and side-effect patterns: $39.99 a year or $9.99 a month on iPhone, open for free in the web beta.